Introduction
Obstructive sleep apnea (OSA) is a common sleep disorder affecting up to 1 billion adults worldwide1. Repetitive upper airway obstructions characterize OSA during sleep, leading to acute physiological changes, including intermittent nocturnal hypoxemia, sympathetic activation, intrathoracic pressure changes, arousals, and sleep fragmentation2–4. Furthermore, the nightly occurrence of these acute downstream effects of airway obstruction is a critical underlying mechanism linking OSA to future complications such as cardiovascular disease, neurocognitive impairment, risk of cancer, and, finally, increased mortality risk4–10.
According to current clinical practice guidelines by the American Academy of Sleep Medicine (AASM)11, OSA diagnosis is achieved by the apnea-hypopnea index (AHI). This metric was defined as the number of times that the airway is partially (“hypopnea”) or completely (“apnea”) closed with a duration of at least 10 s (respiratory events) divided per hour of total sleep time. Therefore, AHI is a frequency-based metric that is useful for grading OSA.
In the last decade, the ability of AHI to predict long-term consequences and response to current therapies has not been evident, and this has been recently highlighted by the Agency for Health Research and Quality (AHRQ) report12–14. AHI was initially defined by expert consensus as a metric to quantify the frequency of respiratory events during sleep12. Therefore, this metric can diagnose and grade the severity of the disease, defining the different classifications of the population with OSA: 1) mild OSA (AHI 5-15 events/h), moderate OSA (AHI 15-30 events/h), and severe OSA (≥ 30 events/h). Historically, these metrics have been a keystone in the decision-making process, providing information about the disease’s severity for prognostic and therapeutic purposes15. For example, AASM practice guidelines strongly recommend continuous positive airway pressure (CPAP), the predominant modality of therapy in OSA patients with AHI ≥ 30 events/h or ≥ 15 events/h with cardiovascular comorbidities16. Moreover, a similar threshold has been included in the design and implementation of several randomized controlled trials (RCTs) to determine the efficacy of different OSA therapies on clinical outcomes, with inconsistent results17–21.
In the last years, different novel polysomnography (PSG)-derived metrics have been developed with favorable implications in the risk stratification, adding complementary data to the AHI12,22,23 Moreover, some metrics have reported a significant interaction with primary outcomes after CPAP therapy24. To better understand these metrics, we categorized the current metrics as non-OSA-specific (calculated from the complete PSG-derived signal) and Osa-specific (calculated based on the apnea-hypopnea event [respiratory event window]).
This review aims to describe the rationality and construction of novel specific OSA-driven metrics (the hypoxic burden [HB], delta heart rate [ΔHR], ventilatory burden [VB], and pulse arrival time [PAT]), providing clinical utility to identify high-risk OSA subtypes of patients.
Current metric: AHI
Even though there is strong evidence of elevated risk of harmful outcomes among individuals with OSA, worse effects are mainly heterogeneous. Indeed, it has been challenging to identify high-risk individuals within the OSA population, according to the AHI25,26. In addition to risk prediction challenges, CPAP therapy data is inconsistent27. Pooled data from RCTs, systematic reviews, and meta-analysis concludes that OSA therapy using CPAP improves the severity of the disease (improves the AHI), improves excessive sleepiness during the day28, and improves blood pressure among hypertensive patients with OSA18. However, the efficacy of CPAP therapy for other clinically significant outcomes is unclear. Clinical studies designed based on AHI have been unable to detect a consistent benefit in cardiovascular (CVD) events, CVD mortality, glycemic homeostasis, or neurocognitive impairment17,29–31.
One of the limitations of the AHI is the lack of information about the consequences and characteristics of the respiratory event (i.e., patterns of hypoxemia, autonomic response, and arousal characteristics)32–34. The paradigm for OSA assessment using standard PSG has remained the same for the past several decades. Multidimensional physiological information obtained from PSG is often condensed to a single number, that is, AHI. Consequently, the oversimplification of PSG using AHI is a significant reason for the inability to gauge CPAP benefit and predict the risk of adverse cardiovascular outcomes in OSA23,35.
In addition, AHI cannot provide information about the accumulative exposure to the OSA. As an example, the pack/year index (pack/year) is a metric commonly used to grade tobacco exposure among smokers, giving information about the risk of either incident chronic obstructive pulmonary disease or lung cancer36. However, to date, neither AHI nor other frequency-based metrics have reported a precise value that reflects the OSA-specific exposure and its association with outcomes. Therefore, these ongoing challenges raise the question of whether the historically adopted conventional OSA (AHI) assessment is the best approach for risk stratification and therapeutic decision-making.
HB
Nocturnal hypoxemia is the most crucial contributor to worse outcomes among OSA patients. The decrease in the SpO2 and the following reperfusion increase the release of inflammatory markers associated with systemic inflammation. There are several surrogate PSG-derived markers of nocturnal hypoxemia in the literature. However, most of them lack precision (the marker is a measure of OSA exposure), Specificity (the exposure is restricted to OSA), and independent validation in large datasets (robustness). The Sleep Apnea Specific HB is a single metric that encapsulates the frequency of upper airway obstructions during sleep (like the AHI), adding information about the duration and depth of respiratory event-related oxygen desaturations. These oximetric parameters are different from other surrogate markers of nocturnal hypoxemia, such as the oxygen desaturation index (ODI), total sleep time below 90% oxygen saturation (total sleep time below 90% [TST90%]), and the “desaturation severity parameter,” among others37. HB is calculated during a participant-specific search window, including desaturation and recovery area associated with different apnea patterns (obstructive, central, or mixed), providing accurate information regarding the nocturnal hypoxemia related to the respiratory event38. The HB is quantified by summing the “area under the SpO2 curve” associated with individual apneas and hypopneas. The total sum is then divided by the sleep duration, yielding units of (%·min)/hr. (i.e., a HB of 20 (%·min)/h, which means 5 min of 4% desaturation every hour of sleep or 2 min of 10% desaturation every hour). By subtracting pre-event SpO2, this metric captures the HB precisely due to OSA rather than other intermittent hypoxia causes.
Development of the HB
As described above, HB is a metric aimed to identify the total exposure to hypoxemia due to OSA; HB provides additional information about the severity and characteristics of hypoxemia in addition to the AHI. Therefore, HB is a specific OSA-driven metric because the development of the metric is based on the respiratory event. The development of the metrics involves the following steps:
– Identification of the ensembled-averaging window: this process includes the label of each apnea-hypopnea previously scored following the AASM criteria11. In this process, the SpO2 signal is analyzed with a new search window focused on the SpO2 values recorded at baseline and posterior to the respiratory event. The pre-event baseline saturation is defined as the maximum SpO2 100 s before the end of the event. Therefore, the end of each respiratory event (time 0 or reference time) is a reference for further analysis (Fig. 1A). After that, a window of time (seconds) between the baseline SpO2 at the beginning of the event and the post SpO2 (end of the event) calculates the desaturation magnitude and the desaturation duration (seconds). Finally, the subject-specific search window was obtained from an averaged desaturation curve for a robust area calculation. The average desaturation curve for each participant was determined by overlaying SpO2 signals for the end of events (Fig. 1B). For example, If the ensembled averaging window has the same shape in the drop in SpO2 signal (i.e., triangular shape) and reported the same desaturation duration across the night, an indirect approximation of total HB can be approximated by AHI × (Desaturation Depth × Desaturation Duration)/2. Hence, it measures the duration, depth, and frequency of respiratory event-related desaturations.
– Identification of the HB per event: in this step, the ensembled averaging desaturation windows are used to reference each event, defining the drop in the SpO2 signal included during the window (Fig. 1C). The primary purpose of HB per event is to calculate the % of desaturation secondary to apnea or hypopnea. If some events are longer (more seconds than the pre-defined time in the ensembled-0-averaging window), they are designed as outliers and, therefore, excluded for further analysis.
– Estimating the total HB: the total hypoxic HB is an accumulative metric that includes the average of total HB per event divided by the total sleep time reported in an hour (%·min)/h. For example, in Figure 1, two patients report the exact SASHB 65 (%·min)/h value. However, Individual #1 reported deeper and shorter events, while Individual #2 reported shallow and more extended events during the night.
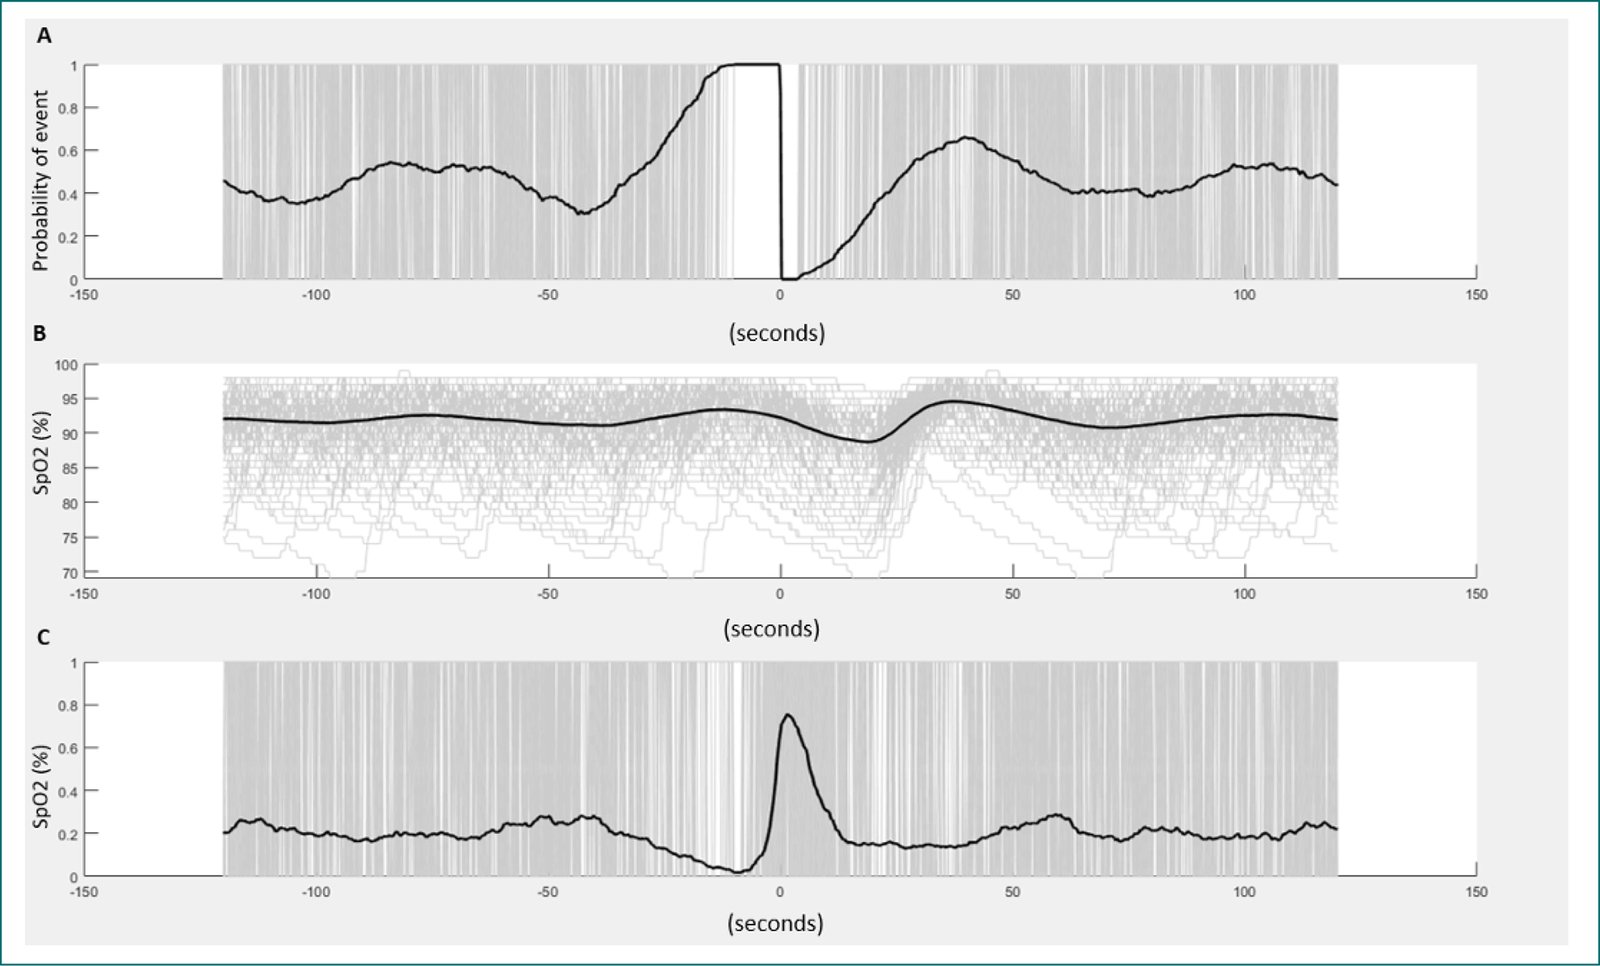
Figure 1. Design and estimation of the hypoxic burden. A: shown the pre-event baseline saturation is defined as the maximum SpO2 during 100 s before the end of the event. Therefore, the end of each respiratory event (time 0 or reference time) is a reference for further analysis. B: shown the overlapping of all respiratory events scored during (Y axis: change in SpO2, X axis: time (second). C: shown the ensembled-averaging window.
In sum, HB is a specific OSA-driven metric that includes different patterns of hypoxemia: the desaturation area (Hb per event) and respiratory events (AHI) frequency. Moreover, HB has two different dimensions of nocturnal hypoxemia: desaturation depth and desaturation duration.
Correlation with other hypoxemic OSA metrics
Other metrics related to hypoxemia commonly included in the PSG provide for TST90%, ODI-3%, and the lowest oxygen saturation during sleep (nadir SpO2), among others. All these metrics have similar limitations to AHI. They are frequency-based metrics that are either non-OSA-specific (e.g., TST90%, whether other previous respiratory conditions can increase the TST90%) or limited to describing the lowest SpO2 associated with one specific respiratory event (nadir SpO2). Therefore, do not consider the character of hypoxemia, autonomic response, or arousal.
This review develops a correlation plot to show the correlation between HB and conventional PSG metrics (TST90%, Nadir SpO2, and AHI) using the Sleep Heart Health Study (SHHS). This dataset is available in the National Sleep Research Resource39. Spearman’s correlation between the HB and AHI, ODI-3%, and TST90% were quantified (Fig. 2). Ideally, for patients with an AHI < 5 events/h, these measures are highly correlated because the number of respiratory events is small, and the variability in different measurements is minimal.
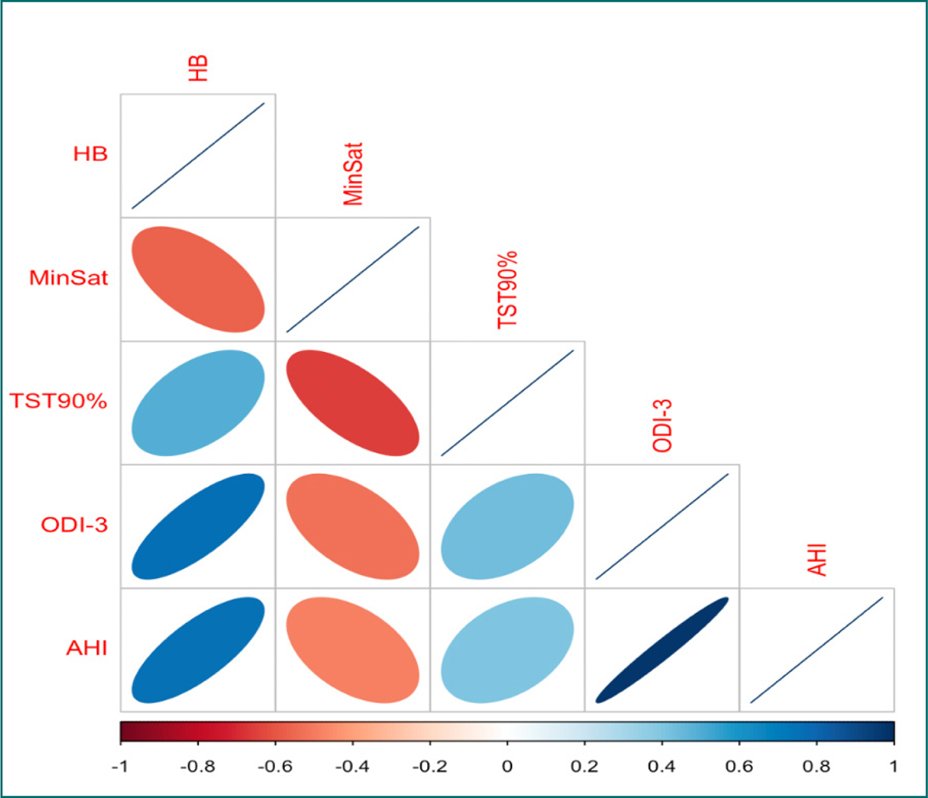
Figure 2. Correlation plot between the hypoxic burden and traditional metrics: total sleep time below 90%, oxygen desaturation index ≥ 3%, apnea-hypopnea index, and minimum desaturation (MinSat).
On the other hand, in patients with severe sleep apnea (AHI > 30), the correlations decrease significantly because many respiratory events could introduce variability in different measures. This could be observed in Figure 3, in which the strength of other associations is shown for SHHS studies, as well as scatter plots of HB versus TST90%. The variability in HB increases substantially as TST90% increases. For example, for a TST90% of 10%, the HB ranges from 40% to 300%/min/h due to the variability in-depth and the duration of event-related oxygen desaturations that AHI does not capture.
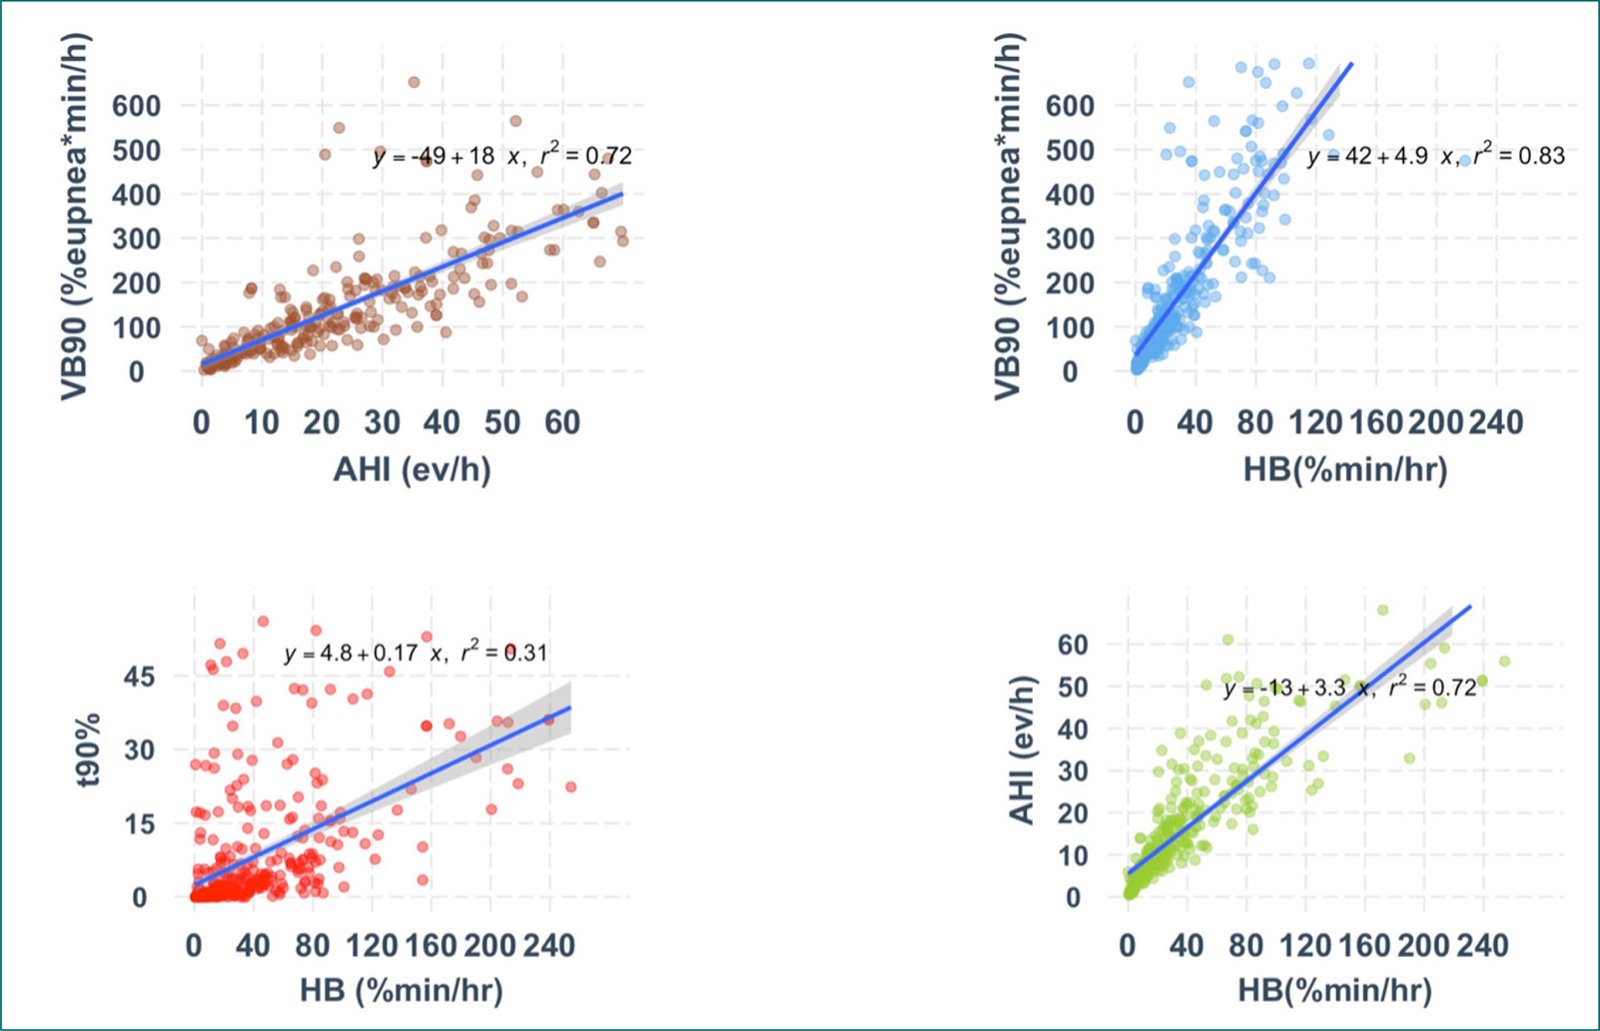
Figure 3. Scattered plot comparing the hypoxic burden, ventilatory burden, T90%, and apnea-hypopnea index.
Clinical evidence of HB
To date, HB has consistently shown a better ability to identify populations with the worst incidents and prevalent outcomes than AHI in community-based and clinic- based cohort studies. The first study using HB as an OSA-driven metric was published in 2019. HB showed an independent risk of CVD mortality after adjustment by conventional CVD risk factors and PSG parameters (AHI and Total time under 90%) in two community-based cohorts (SHHS and The Osteoporotic Fractures in Men Study [MrOS])40. Individuals in the highest two quintiles in the MrOS study (HB ≥ 62 (%·min)/h) had adjusted hazard ratios of 1.81 (95% confidence interval [CI]: 1.25, 2.62) and 2.73 (95% CI: 1.71, 4.36), respectively. Similarly, the group in the highest HB quintile in the SHHS had a hazard ratio of 1.96 (95% CI: 1.11, 3.43).
In an additional analysis, HB and AHI were evaluated as predictors of incident heart failure in SHHS and MrOS cohort studies41. As a result, HB was independently associated with an increased risk of incident Heart failure in the SHHS (HR, 1.18 [95% CI, 1.02-1.37], and HR 1.22 [95% CI, 1.02-1.45]) in MrOS cohort studies; conversely, AHI was not associated with Incident Heart Failure in both cohorts.
Association between HB with hypertension and chronic kidney disease (CKD)
Extensive evidence links HB with both hypertension and CKD. In the Multi-Ethnic Study of Atherosclerosis (MESA) cohort, HB was associated with a higher prevalence of moderate-to-severe CKD42. Specifically, OSA patients showed a 20% higher prevalence of moderate-to-severe CKD. Additional analyses revealed that participants with elevated HB had a 36% higher prevalence of moderate-to-severe CKD, with those in the highest HB quintile showing a 28% increase.
Regarding the association between HB and hypertension, a cross-sectional analysis by Kim et al. (2019) examined 1837 individuals with a mean age of 68.4 years included. A higher HB was associated with a 1.1% increase in systolic blood pressure (95% CI: 0.1-2.1) and a 1.9% increase in diastolic blood pressure (95% CI: 1.0-2.8) among individuals not taking antihypertensive medications in the MESA community-based cohort study43,44.
Implementing this novel metric has facilitated advancements in precision medicine, enabling a more precise stratification of patients with OSA. Furthermore, it has facilitated a more accurate identification of predictors of OSA-related susceptibility to adverse health outcomes, including increased blood pressure, major cardiovascular events, and mortality45–47. Moreover, this metric has enabled a more precise assessment of treatment response, highlighting the critical role of hypoxic episodes in the pathogenesis of hypertension associated with OSA.
HB and risk of incident CVD disease and CPAP benefit
The ISAACC study was a multicenter RCT whose objective was to evaluate the effect of OSA and its treatment with CPAP on the clinical evolution of patients with acute coronary syndrome19. The findings indicated that OSA was not associated with an elevated incidence of cardiovascular events. Moreover, CPAP did not yield a notable reduction in the incidence of cardiovascular events. Nevertheless, post hoc analyses by Pinilla et al.48, which included 362 CPAP-treated patients and 365 controls, demonstrated that those with higher HB exhibited a significant reduction in cardiovascular events following CPAP treatment (HR 0.57 [95% CI 0.34-0.96]). These findings highlight that higher HB values are associated with a long-term protective effect of CPAP on cardiovascular prognosis.
Association between HB and neurocognitive outcomes
As is known, OSA has been associated with cognitive impairment49 in young and middle-aged adults. Whereas older adults, OSA has been associated with the development of mild cognitive impairment or Alzheimer’s disease50. The proposed mechanisms linked with inducing neurodegenerative changes are intermittent hypoxia, sleep fragmentation, reduction of Non-Rem sleep, and intrathoracic pressure swing, which are possible mechanisms by which OSA induces neurodegenerative changes50.
In this line, structural changes in white matter in OSA patients have also been reported. The white matter is the medullary core of the cerebral and cerebellar hemispheres. Its primary function is to facilitate the connection between neurons from disparate brain regions through myelinated nerve fibers. Kim et al. found a twofold increased risk of white matter changes (WMC) in patients with moderate-to-severe OSA51, even after adjusting for cardiovascular disease. Similarly, Rostanski et al.52 observed volume changes in older adults, independent of hypertension and age, and confirmed by sensitivity analysis excluding dementia cases.
In this domain, HB has also been associated with changes in white matter (WMC) in patients with OSA. A recent study conducted by Hajipour53 using the MESA cohort demonstrated an association between HB and a marker of white matter injury in older individuals. This association remained statistically significant even after adjusting for potential confounding factors. In contrast, metrics including VB, arousal burden (AB), AHI, arousal index, and T90 did not demonstrate such an association with white matter injury. From this perspective, HB quantification could identify structural brain damage, suggesting the potential clinical role of HB metrics in early diagnosis of cognitive impairment.
Association with pregnancy and worse outcomes
Pregnancy is characterized by biological adaptations that facilitate fetal development and maternal health. Monitoring specific biomarkers during this period can facilitate the identification of potential complications at an early stage. Significant anatomical and physiological changes occur during pregnancy, primarily hormonal and cardiometabolic. In this context, Ni et al.54 suggest that HB may be a valuable metric for monitoring pregnant women and neonates. In early pregnancy, HB served as a predictor for pre-eclampsia, while in mid-pregnancy, it predicted gestational diabetes. In neonates, higher HB was associated with an Apgar score below seven at the 1st min.
External validation of HB
HB is the only sleep-specific metric with external validation in a clinical-based population. Recent data from the Pays de la Loire cohort, a sleep-based cohort study in France, reported an independent association between high HB and incident major composite cardiovascular endpoints (MACE) among newly diagnosed OSA. Trzepizur et al., including a total sample of 5,358 OSA patients with a follow-up of 6.5 years, evaluated different OSA-phenotypes approaches (including symptom-based clustering, heart rate variability, and HB). As a result, the approach based on the highest quantile of HB (defined as 71% min/h) was independently associated with an increased risk of incident MACE55.
Furthermore, the predictive role of HB across diverse populations warrants evaluation. The diagnostic and therapeutic implications of HB metrics, especially for OSA, underscore the need for such studies. Recently, Li et al.56 validated HB in a Chinese population, assessing its predictive value in 2,303 individuals with suspected OSA (1,200 in the experimental group, 1,103 in the validation group). Findings revealed a significant correlation between HB and several anthropometric indicators and sleep oxygen metrics. Notably, HB was predictive of OSA severity. Nevertheless, the predictive accuracy of waist and hip circumference, waist-hip ratio, and AHI for OSA severity was lower than that of HB56.
Limitation and future agenda
Although HB data showed a better identification of high-risk OSA phenotype, there is still a gap in the literature regarding pre-defined population characteristics, such as gender, race, and age contribution to HB. In addition, Intermittent hypoxemia has a 3-dimensional feature (including depth [change in SpO2 from baseline], duration [time in the drop and recovery period], and magnitude [time to drop until nadir or recovery SpO2]), with different interactions and different effects in the intermittent hypoxemia-reperfusion cycle. The clinical consequences and the interaction between these distinct patterns of hypoxemia in both pulmonary and cardiac systems need to be well-known. HB includes two other domains (desaturation depth and duration) in this scenario. However, it fails to identify different desaturation patterns, and HB does not distinguish between short/deep and long/shallow desaturations. As described above, two subjects can report the same AHI and HB but different events during the night.
Finally, further research related to HB should be focused on identifying critical clinical differences between the current approach (place the HB per event based in the baseline SpO2) or adjusting the baseline SpO2 using pre-defined cutoff (SpO2 90%, 85%, others) and the interaction between HB with intermittent hypoxemia in patients with chronic hypoxemic diseases, or high-altitude population. Finally, further research should include prospective clinical data and novel RCTs to determine the association between HB as an indicator of health outcomes as a predictor of better response to CPAP therapy.
∆HR
Autonomic activation after the respiratory event is another domain associated with worse outcomes among OSA patients. Similar to HB, several metrics are reported to determine and grade the severity of the exposure, with a similar limitation described above (lack of Specificity, measure of exposure, and independent validation). The OSA-specific heart rate response (ΔHR) reports the change in the heart rate due precisely to the respiratory event. ΔHR is estimated using pulse signals derived from the photoplethysmography (PPG) used in the pulse oximetry sensor. It was chosen over the use of electrocardiography (ECG) because pulse oximetry is commonly used in home sleep apnea testing, making the broad future application of this new prognostic biomarker possible.
Construction of the ΔHR
The ∆HR is developed as the difference between a maximum heart rate during a subject-specific search window and an event-related minimum heart rate (the minimum heart rate during apneas/hypopneas)57. Like HB, ∆HR was developed from an ensembled-averaging window (Fig. 2 shows a search window extended from the pre-event minimum to the event-related, ensemble-averaged heart rate). Then, each respiratory event reports and a specific ∆HR, and the individual-level ∆HR is defined as the mean of all event-specific responses.
Clinical evidence of ∆HR
This metric is strongly associated with subclinical CVD, incident CVD, and CVD and all-cause mortality on two community-based cohorts (SHHS and MESA)57. In both datasets, ∆HR reported a nonlinear distribution across the population, A U-shaped association between ∆HR (low ∆HR: < 5.8 bpm), (midrange ∆HR: 5.8-10.1 bpm), and High ∆HR: > 10.1 bpm) with clinical outcomes such as subclinical CVD (coronary artery calcium, NT-proBNP, and Framingham risk score) was observed in the MESA cohort, indicating both low ∆HR (potentially reflects an under-responsive cardiovascular system possibly due to existing heart disease and/or diabetes) and high ∆HR (a marker of severe respiratory events or an overreactive autonomic response to events) were associated with subclinical CVD.
Moreover, in the longitudinal analysis in SHHS, high ∆HR predicted non-fatal and fatal CVD and all-cause mortality in the fully adjusted model. Additional multivariable Cox analysis confirmed independent associations between high ∆HR and non-fatal HR 1.60 (1.28-2.00); fatal CVD, HR 1.68 (1.22-2.30), and all-cause mortality, HR 1.29 (1.07-1.55). Moreover, high HB (≥ 62% min/h) and ∆HR provide stronger associations with incident CVD and mortality. The non-fatal/fatal CVD and all-cause mortality were substantially higher in those with high HB and high ∆HR (adjusted hazard ratio (95% CI): non-fatal: 1.93 (1.36-2.73); fatal: 3.50 (2.15-5.71); all-cause mortality: HR 1.84 (1.40-2.40). The findings did not change for these metrics in a sensitivity analysis that excluded those on beta-blockers, those with prevalent atrial fibrillation, or cardiac pacemaker users at baseline.
This metric showed a stronger association in the non-sleepy OSA in an additional analysis. The association between high ∆HR with CVD events was observed in non-sleepy individuals (defined as Epworth sleepiness scale < 11 points and absent excessive sleepiness during the day, according to the SHHS questionnaire) reporting an HR of non-fatal CVD: 1.77 (95% CI: 1.34-2.33), fatal CVD: HR 1.97 (95% CI: 1.37-2.83), all-cause mortality: HR 1.39 (95% CI: 1.12-1.74).
This metric can also better identify a subgroup of participants with better responses to CPAP therapy. In a secondary analysis of the randomized intervention with CPAP in coronary artery disease and OSA trial24, including 225 participants with moderate to severe (AHI ≥ 15 events/h), non-sleepy OSA (ESS < 10 points), allocated to CPAP or control (CPAP: 112 participants; control: 113 participants) with an average follow-up of 57 months. High ∆HR can identify a subgroup of the OSA population with a better response after CPAP therapy. The interaction between ∆HR (defined as ∆HR ≥ 10.8 bpm) with incident CVD event was HR: 0.51 (95% CI, 0.26-0.98).
Recently, in a secondary analysis of the Heartbeat study, A high versus mid-∆HR predicted improvement in SBP (adjusted estimate, 5.8 [95% CI, 1.0-10.5] mm Hg). Independently, a more significant treatment-related reduction in HB was significantly associated with more substantial reductions in SBP (4.2 [95% CI, 0.9-7.5] mm Hg/2 standard deviation [SD] treatment-related reduction in HB). In this analysis, participants with substantial versus minimal treatment-related reductions in HB had a 6.5 (95% CI, 2.5-10.4) mm Hg drop in SBP.
Limitation and future agenda
Although the information provided by this metric helps identify a subgroup of OSA patients with a high risk of complications and response to CPAP therapy, in addition, there are gaps related to the within-individual response and Autonomic activation (changes in blood pressure, catecholamines levels, other), further research including prospective data collection, and RCTs designed OSA patients with these metrics are helpful. Moreover, the interaction between HB and ∆HR is another gap for future research. A better comprehension of the physiological changes related to the respiratory event and the cardiopulmonary consequences of OSA is a significant answer to working in the field. Second, an automatic analysis of ∆HR from the pulse oximetry signal is needed, like HB.
VB
The VB quantitatively assesses another fundamental physiological component associated with the severity of OSA. At present, there are two different techniques to calculate VB from a sleep study. First, this metric can be defined as the proportion of overnight breaths in which the airflow amplitude is < 50% during sleep58. In their study, Parekh et al. (2023) proposed the VB metric for respiratory events, whereby the VB was predictive of all-cause and CVD mortality in the SHHS cohort, both before and after adjusting for covariates, including HB. In contrast, no association was observed between the AHI and CVD mortality in the SHHS cohort. These findings highlight the utility of the predicted role of VB metrics related to critical health markers such as all-cause and CVD mortality, as well as the strong association between daytime sleepiness and hypertension58.
VB can also be calculated from the airflow signal, determining the area under the curve associated with respiratory events compared with the eupneic period. In this line of research, Labarca et al.59 analyzed two distinct cohorts, MESA and MrOS, to investigate the relationship between HB and the incidence of CVD. Furthermore, this study examined the relationship between VB and AB. The results indicate a notable correlation between HB (MESA, 95% CI: 1.45 [1.14, 1.84]; MrOS, 95% CI: 1.13 [1.02, 1.26]) and VB (MESA, 95% CI: 1.38 [1.11, 1.72]; MrOS, 95% CI: 1.12 [1.01, 1.25]) in the prediction of CVD morbidity and mortality. However, the VB was slightly weaker than the HB. In addition, the study suggests that VB contributes to approximately 80% of the variability in HB.
Limitation and future agenda
VB is strongly correlated with HB, nor AHI or T90. Figure 2 shows the association within metrics. The measurement of respiratory flows has been a considerable debate within respiratory medicine. At present, there is a plethora of clinical and home-use diagnostic devices for OSA11. The discrepancies in the protocols and devices utilized to assess airflow can result in misdiagnosis. On the other hand, pulse oximetry has been extensively employed, demonstrating greater standardization, simplicity, and the necessity for less monitoring compared to airflow quantification60,61. However, inaccurate oxygen saturation measurement in individuals with dark skin tones has been observed62,63. Indeed, recent analyses that aimed to examine racial/ethnic differences in sleep desaturation severity by considering ventilatory deficits and confounders have concluded that reductions in ventilation result in less measured desaturation in subjects with dark skin tones than in white participants64.
The technical difficulties have the potential to introduce bias and may result in an increased prevalence of occult hypoxemia among subjects with dark skin tones. This could have implications for clinical management in this population, potentially leading to an elevated mortality rate65.
PAT
The PAT is another novel metric aimed at identifying the changes in blood pressure in response to respiratory events66. This concept is based on the time delay of pulse propagation between two points in the arterial system (a surrogate measure of pulse transit time)67. This metric can be estimated from the change in BP in arterial stiffness.
Construction of PAT
Like the metrics mentioned earlier, Previous respiratory events are scored, and ensembled average windows of ± 3 s from the end of individual events are created. Then, PAT is constructed using the ECG and PPG waveform from pulse oximetry derived from the PSG. The raw data from the ECG and PPG signal at 1 Hz is synchronized, and the difference in the time delay between the ECG R- wave peak and the onset of the waveform, and the time between the R-wave peak and PPF foot is the PAT.
In the next step, the significant event-related PAT has been identified as a maximum decline larger than a subject-specific threshold to the mean + 2 standard deviation of all respiratory events related to PAT declines outside the search window. Therefore, the PAT response is defined as the area under the PAT decline curve between the latter of the actual zero crossing or any minimum – before the peak decline and the “earlier” of the existing zero crossing of the first local minimum.
Clinical evidence of PAT
Kwon et al. evaluated the clinical utility of PAT to identify the high risk of subclinical CV risk in the MESA cohort66. As a result, per 1 SD in average PAR response was associated with an 18% higher risk of incident CVD. However, after adjustment by AHI, the HR was 1.18 (0.99-1.40), p = 0.06.
Limitation and future agenda
Compared to other OSA-specific metrics, data about PAT is limited, and future research using this metric alone or in combination with ∆HR or HB can provide more evidence about sympathetic activation after respiratory events. However, the clinical implementation of these metrics included the PPG signal, in association with PSG-derived ECG, providing less utility in the domiciliary studies aimed at identifying and stratifying OSA patients.
Conclusion
Recently, novel OSA-driven metrics have been reported to identify OSA populations with a high risk of long-term consequences beyond the AHI. For example, metrics derived from the respiratory event (apnea-hypopnea) provide helpful information to physicians and patients. Future research should integrate these metrics to explore the interaction between nocturnal hypoxemia, sympathetic response to hypoxia, and the arousal contribution as measures of OSA exposure to improve preventive strategies and include population based on this, OSA-driven metric prospective clinical trials.
Authors contributions
G. Labarca: guarantor of the paper, data extraction, statistical analysis, manuscript draft, and final review; M. Henríquez-Beltrán and D. Solomon: data acquisition, manuscript preparation, figure preparation. All authors approved the final manuscript.
Funding
This study was supported by a grant FONDECYT 11240972. G. Labarca reports grant support from the Agencia Nacional de Investigación y Desarrollo (ANID).
Conflicts of interest
There are no conflicts of interest to declare.
Ethical considerations
Protection of humans and animals. The authors declare that no experiments involving humans or animals were conducted for this research.
Confidentiality, informed consent, and ethical approval. The study does not involve patient personal data nor requires ethical approval. The SAGER guidelines do not apply.
Declaration on the use of artificial intelligence. The authors declare that no generative artificial intelligence was used in the writing of this manuscript.
