Obstructive sleep apnea (OSA) is the most common sleep-disordered breathing disorder, with a variable prevalence ranging from 4% to 30% depending on the environment1,2.
OSA induces intermittent hypoxia, sleep fragmentation, and changes in intrathoracic pressure that promote the development of cardiovascular disease, arrhythmias, ischemic heart disease, hypertension (HTN), pulmonary thromboembolism, pulmonary HTN, heart failure, diabetes mellitus, neoplasia, neurodegeneration, depression, and traffic accidents1,3,4.
The diagnosis of OSA is based on clinical history and a sleep test. Polysomnography is considered the gold standard by the American Academy of Sleep Medicine (AASM)5, although the most commonly used diagnostic method today is respiratory polygraphy, which has similar reliability6,7.
Among the new challenges in sleep medicine are the development of new simplified diagnostic methods and automatic correction systems for polysomnographic studies based on artificial intelligence (AI). Another objective of sleep medicine is to use big data to better understand the disease and develop clusters that can optimize diagnosis and treatment8,9. In this review, we will focus on advances in AI in each of these aspects of OSA diagnosis.
AI is based on the development of technological systems capable of performing tasks that require human intelligence, such as learning, reasoning, perception, and problem solving. These systems use data to detect patterns, learn from experience, and make decisions or take actions autonomously, imitating human cognitive abilities10. A subfield widely used in sleep medicine is machine learning (ML), which is based on learning from data, patterns, and decision-making without being explicitly programmed for each task.
ML learning can be structured into supervised, unsupervised, semi-supervised, and reinforcement learning (Table 1)11,12.
Table 1. Types of ML
| Type of ML learning | Description | Most commonly used algorithms |
|---|---|---|
| Supervised | ML technique that uses human-labeled input and output datasets to train AI models. The most common tasks are data classification (data separation) and regression (data matching) | Linear regression, logistic regression, Bayesian regression, random forest, SVM, decision trees, KNN, CNN, RNN/LSTM |
| Unsupervised | Learning that uses ML algorithms to analyze and group unlabeled data sets without human intervention. It is used to extract features, identify trends, and group results | K-eans, hierarchical clustering, Gaussian mixture model, spectral clustering, PCA, ICA, NMF, CRF, HMM, and RBM |
| Semi-supervised | A hybrid between supervised and unsupervised learning. It operates with labeled and unlabeled data. The objective is to provide better results for prediction using only labeled data | Semi-supervised Gaussian Mixture Models, semi- supervised VAE, semi-supervised SVM, semi-supervised CNN, semi-supervised graph CNN, semi-supervised KNN |
| Reinforcement | Machine learning model that improves decision-making through positive, neutral, and negative feedback | DQN, SARSA, PPO, A2CA3C, TD, Montecarlo algorithm |
ML: machine learning; SVM: support vector machine, KNN: K-nearest neighbors, CNN: convolutional neural network, RNN: Recurrent neural network, LSTM: long short-term memory, PCA: principal component analysis, ICA: independent component analysis, NMF: non-negative matrix factorization, CRF: conditional random field, HMM: Hidden Markov models, RBM: Boltzmann machines, VAE: Variational autoencoders, DQN: Deep-Q networks, SARSA: State-action-reward-state-action, PPO: proximal policy optimization, A2CA3C: Policy gradient, Advantage Actor-Critic, TD: temporal-difference learning.
Neural networks are a type of ML algorithm that imitates the structure and functioning of the human brain to learn and make decisions. They are characterized by their structure of layers of interconnected nodes (neurons) and are particularly effective at handling complex, non-linear relationships in data, making them a key component of deep learning13. In the field of sleep medicine, neural networks have become increasingly important in recent years because the polysomnography (PSG) signal requires only minimal preprocessing and adapts well to time series14. Among the various ML algorithms (Table 1), the most widely used in sleep medicine have been convolutional neural networks (CNN) and recurrent neural networks (RNN)9.
CNNs (Fig. 1) are based on the analysis of input data to detect local patterns and combine them. They are particularly useful in image analysis. Convolution allows the combination of input data with a core that acts as a detector of features, patterns, or images in each of the linear patterns15,16.
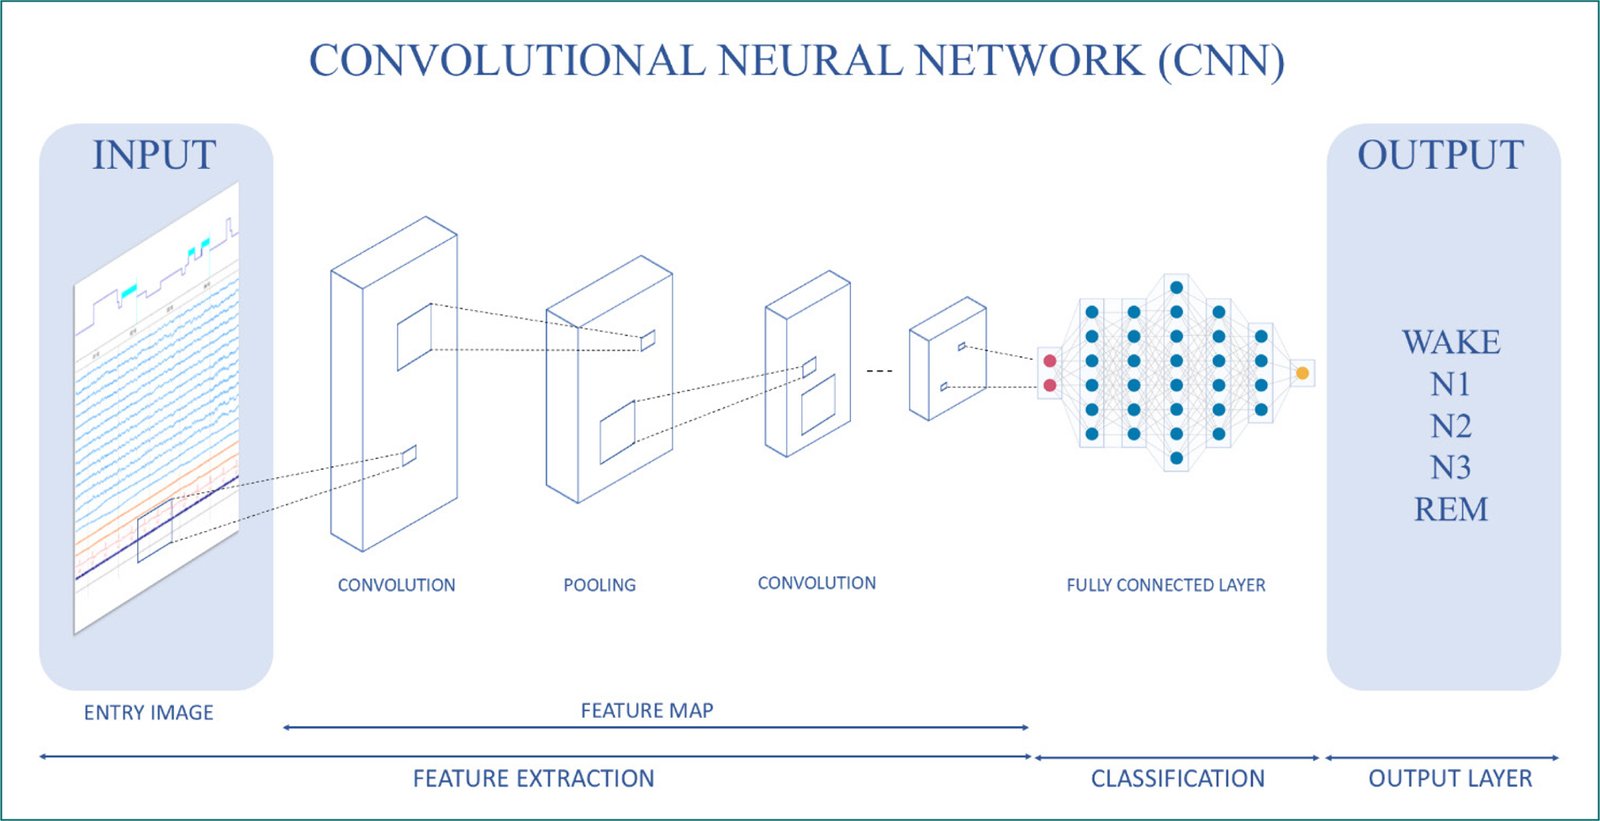
Figure 1. Convolutional neural network operating algorithm.
In contrast, RNNs (Fig. 2) are a type of artificial neural network that processes sequential data. Therefore, they are designed to process data sequences such as text or audio. RNNs have connections that allow feedback, which means that the output of one layer can be used as the input for the next, creating an internal memory. This allows temporal dependencies and sequential patterns to be captured17.
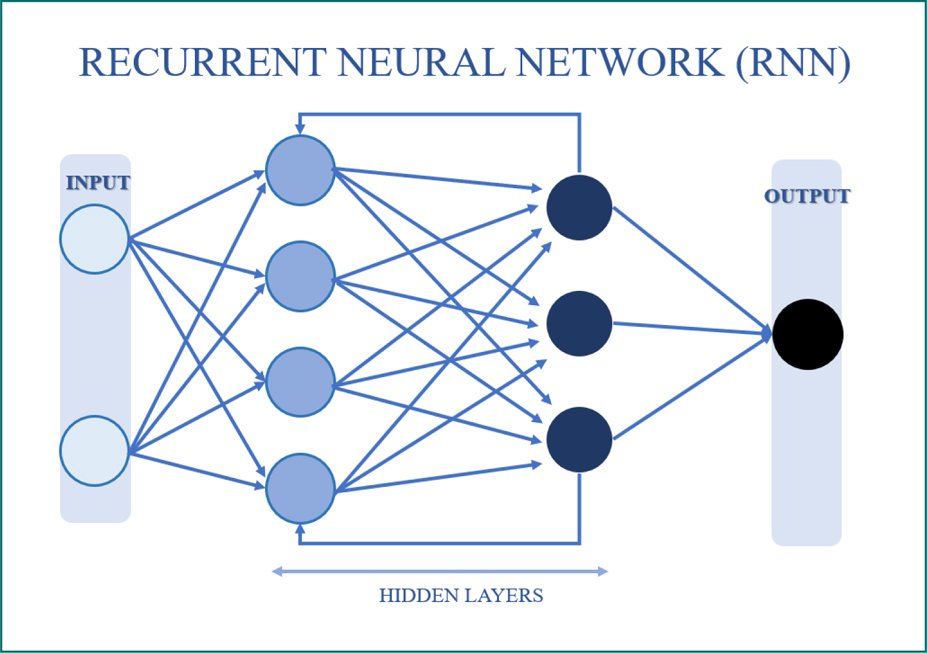
Figure 2. Recurrent neural network operating algorithm.
It should be noted that the initial approach of AI to sleep medicine was aimed at facilitating the correct classification of sleep stages, as well as the detection of respiratory events. The first published work on neural networks in sleep medicine was in 199118. In this study, a neural network was developed to classify sleep stages in cats. Manual correction was used as a reference, and data from electrooculograms, sleep waves, electromyograms, and movement artifacts were collected as input data. There is a 93.3% concordance when using neural networks to score wakefulness, slow-wave sleep, desynchronized sleep, and the transition from slow-wave to desynchronized sleep.
Subsequently, in 1992, neural networks were used in records of children aged 6 weeks, 6 months, and 1 year19. Multilayer Perceptron (a neural network consisting of several layers of neurons) and Learning Vector Quantizer (a supervised learning algorithm for classifying data into sets of classes) were used. A correct classification of 65-80% of the epochs of 6-month-old children was obtained.
Subsequently, in 1996, 61,949 episodes corresponding to 60 patients (20 control patients, 20 patients with depression, and 20 patients with insomnia treated with benzodiazepines) were analyzed20. The concordance between the two correctors was 87.5%, while the concordance between manual and automatic correction was 82.3%. Adding human supervision of ambiguous or doubtful epochs increased the concordance to 90%.
In addition to facilitating the correction of polysomnographic studies, ML algorithms have enabled the development of new diagnostic tools for sleep disorders. In the work of Mosquera-López et al.,21 a decision tree and linear regression algorithm was used with a customized non-contact pressure-sensitive device. Fourteen patients were included who underwent both the polysomnographic study, a diagnostic study at home, and the study with the non-contact pressure-sensitive device. With the new device, a correct OSA detection rate of 82.9% (sensitivity: 88.9%, specificity: 76.5%) and a severity accuracy of 74.3% (severity accuracy of 61.5% compared to the polysomnographic study and 81.8% compared to the home diagnostic study) were obtained. There were also no differences in the apnea-hypopnea index (AHI) between the home diagnostic study and the non- contact pressure-sensitive device (p = 0.62).
In another study, researchers used a single-channel signal for the diagnosis of OSA22. They chose the electrocardiogram signal due to its relevance and ease of recording. Modified CNNs (LeNet-5) with adjacent segments were used for better detection, and a correlation of 0.943, accuracy of 97.1%, sensitivity of 100%, and specificity of 91.7% were obtained in the AHI, achieving better results than traditional ML systems.
Chang et al. used long short-term memory (LSTM) (a type of RNN specialized in processing and predicting long-term data sequences) for the detection of respiratory events in PSG23. A measurement module was designed that integrated signals from triaxial accelerometers (detecting vibrations on three perpendicular axes) in the chest and abdomen, a pulse oximeter, and an electrocardiogram sensor. Using this algorithm, they classified respiratory events into obstructive apneas, central apneas, hypopnea, and normal breathing. A total of 115 patients were included, and the algorithm’s results were compared with expert correction of the PSG. The model’s accuracy with respect to AHI severity groups was 89.3%, the difference in AHI with respect to the PSG was 5 ± 4.5 apneas/h, and the accuracy for detecting respiratory events was 92.3%.
Another study described a diagnostic algorithm for OSA using smartphones based on SpO2. The support vector machine (SVM) algorithm was employed, which is a supervised algorithm used for classification and regression, allowing the elements of a data set to be classified into groups24. Using this system, the algorithm can obtain physiological data from a phone, upload it to the cloud, and send a diagnostic report to the terminal. Twenty-five participants were analyzed, obtaining a sensitivity, precision, and specificity of 87.6%, 90.2%, and 94.1%, respectively.
A one-dimensional CNN model has also been used to evaluate single-lead electrocardiogram signals25. Seventy-five patients were analyzed, and it was found that the proposed model achieved an accuracy of 87.9%, a specificity of 92.0%, and a sensitivity of 81.1% for the detection of apneas.
Another aspect analyzed for the diagnosis of OSA was daytime tracheal noises. A study was conducted to compare two ML tools for classifying subjects with OSA using daytime tracheal noises26. To do this, a microphone was placed in the suprasternal region and random forest (RF) algorithms were used, which is a ML model that creates decision trees and combines their predictions to obtain a more accurate result, and regularized logistic regression, which allows the probability of an input belonging to a specific category or class to be predicted. It was found that RF outperformed logistic regression in terms of accuracy, sensitivity, and specificity, while logistic regression was faster and generated a more parsimonious model. According to the results of the study, both were useful for the detection of daytime OSA.
Finally, Kuan et al. developed simple and generalized predictors of OSA27. They conducted a retrospective, single-center observational study that evaluated the diagnostic relevance of age, sex, and body mass index (BMI) for a cohort of 9422 patients. Logistic regression and artificial neural network algorithms were used, employing age, sex, and BMI as predictors of moderate and severe OSA risk. The results revealed that age, sex, and BMI were significantly linked to OSA. The areas under the curve for validation of the logistic regression and artificial neural network models were 0.806 and 0.807, respectively. The models powered by logistic regression and artificial neural networks with these three simple parameters effectively predicted OSA.
Therefore, in the coming years, due to advances in ML, there will be a window of opportunity for new diagnostic tests. However, AI has also contributed to the cluster analysis of patients with sleep-disordered breathing.
Nakayama et al., used cluster analysis to classify OSA patients into subgroups based on PSG variables28. To do this, patients with moderate or severe OSA without cardiac pathology were recruited, and apneas, types of apnea, duration of events, minimum oxygen saturation, arousal index, and frequency of events in the supine position were analyzed. A total of 2100 patients were included and three clusters were stratified. Cluster one had a high number of apneas and severe desaturations, cluster two had a high number of apneas and long event duration, and cluster three had a low number of apneas. This division into subgroups could help to individualize treatment.
Another study characterized OSA symptom subtypes and assessed their association with the prevalence and incidence of cardiovascular disease29. A total of 1207 patients with OSA (AHI > 15 apneas/h) were analyzed, and the associations between symptom subtypes and cardiovascular disease in general and according to type of pathology (coronary artery disease, heart failure, and stroke) were evaluated using logistic regression. Four symptom subgroups were identified: sleep disturbance (insomnia) (12.2%), minimal symptoms (32.6%), excessive sleepiness (16.7%), and moderate sleepiness (38.5%). The excessive sleepiness group had a higher risk of cardiovascular events. Therefore, OSA symptom subtypes are associated with cardiovascular risk, highlighting their clinical relevance.
Cluster analyses have also been applied to servo-ventilation. The OTRLASV study sought to explain the excess cardiovascular mortality observed in the SERVE-HF study30. It was suggested that excess ventilation in servo-ventilation could be the cause of increased cardiovascular mortality. Patients treated with servo-ventilation for at least 1 year were included. Eight physicians participated in adjusting the servo-ventilation parameters and comparing groups according to sleep-disordered breathing (OSA, central sleep apnea, and treatment-emergent central sleep apnea) and unsupervised groups using k-means cluster analysis (an unsupervised learning algorithm used to group similar observations and discover patterns that are not immediately apparent). Five clusters were identified (Cluster 1: men with treatment-emergent central sleep apnea and heart disease; Cluster 2: men with central sleep apnea and heart disease; Cluster 3: men with central sleep apnea emerging from CPAP treatment without heart disease, Cluster 4: women with high BMI, treatment-emergent central sleep apnea and heart disease, and Cluster 5: men with OSA and decreased FEV1).
The groups according to sleep-disordered breathing did not differ in servo-ventilation settings, but the five k-means clusters generated differed. Patients in Cluster 5 had lower end-expiratory positive pressure (EPAP) compared to Clusters 1 and 4. The use of Auto-EPAP was higher in cluster 3 than in Clusters 1 and 2. On the other hand, individual servo-ventilation data suggested that the risk of hyperventilation is not related to either the group or the type of servo- ventilation monitoring31.
Therefore, cluster analysis using AI may be a tool to be used in the future to classify patients and allow for individualized treatment. Another important use of AI in the diagnosis of sleep-disordered breathing is the automatic correction of polysomnographic studies.
Manual correction of PSG is a laborious and complex process with marked variability between correctors, especially in the identification of awakenings and sleep stages32. That is why, in recent years, advances in AI have spread to medicine, and especially to sleep medicine, facilitating improvements in diagnosis, risk stratification, and response to treatment12.
In response to the limitations in the correction of polysomnographic studies, computerized algorithms have been developed to analyze electrophysiological signals and classify sleep stages and respiratory events, achieving a high level of agreement with manual scoring by sleep medicine experts. In particular, computerized algorithms have been validated with manual scoring as the reference standard33. An automated scoring system can be considered a valid alternative if the level of agreement between automated and manual scoring is comparable to the level of agreement of manual scoring. Automatic scoring systems have been used in the correction of sleep studies for more than 20 years.
Early algorithms were capable of detecting desaturation, snoring, heart rate, and position34,35, while current algorithms can also detect sleep stages, respiratory events, and micro-awakenings using one or more channels, evaluating the spectral power threshold of frequency bands, and detecting waveforms through pattern recognition36,37. Although other automatic sleep study correction systems have been validated with strong correlations with manual corrections, only Somnolyzer (Philips Respironics), Ensosleep (Ensodata), and Domino (Somnomedics AG) have been certified by the AASM38.
The most widely used AI-based computer-assisted sleep staging system is Somnolyzer 24 × 7, which is approved by the Food and Drug Administration and follows the scoring guidelines of the AASM. As for Somnolyzer, the latest version includes an AI classifier with short- and long-term bidirectional RNN that allows for more accurate correction. Several studies in adults have demonstrated a high correlation in both sleep architecture and respiratory event detection (Table 2)39–48.
Table 2. Summary of the results of the most relevant articles comparing manual scoring with Somnolyzer system scoring
| Anderer et al.40 | Epoch-by-epoch agreement: 80% (Cohen relevant articles comparing manual sc × 7 and human expert scoring). Inter-rater reliability (2 experts): 77% (Cohen 0% (Cohen relevant articles comparing manual sc × 7 and human expert scoring). Inter-rater reliability CNN, experts): close to 1 (Cohen’s kappa: 0.991). |
| Barbanoj et al.41 | Epoch-by-epoch agreement: 80%. |
| Anderer et al.42 | Epoch-by-epoch agreement between manual scoring 1 and semi-automated scoring 1: 82% (kappa: 0.76) and between manual scoring 2 and semi-automated scoring 2: 81% (kappa 0.75). Cohen’s kappa between automated and manual scoring 1: 0.71. Cohen’s kappa between automated and manual scoring 2: 0.72. Spearman rank correlation between manual and semi-automated scoring: N1 (%): 0.76, N2 (%): 0.74, N3 (%): 0.89, REM (%): 0.85. |
| Griessenberger et al.43 | Overall agreement of all epochs: 80.9% (Cohen’s kappa: 0.69). Significant correlation in light sleep (r = 0. 480) and deep sleep (r = 695). |
| Punjabi et al.39 | Pearson correlation coefficient (r) of AHI between manual and automated score: 0.93 (95% CI 0.91-0.96). Average bias in AHI: 2.48 events/h (95% CI 0.40-4.55). Pearson correlation coefficient between manual and automated score of sleep architecture (N1: 0.63, 95% CI: 0.57-0.70; N2: 0.66, 95% CI: 0.59-0.74; N3: 0.65, 95% CI: 0.57-0.7; REM: 0.92, 95% CI: 0.91-0.94). |
| Magnusdottir et al.45 | Sensitivity: 93%, specificity: 79%, Cohen’s kappa: 0.74, agreement: 87% |
| Bakker et al.46 | Intraclass correlation coefficient for all sleep stages between automatic and manual score: 0.91 (Wake: ≥ 0.93, N1: 0.72-0.74, N2: 0.88-0.89, N3: 0.85-0.94, REM: 0.96-0.97). |
| Cheng et al.47 | Accuracy of sleep staging: 77% (76.8-77.35), Cohen’s kappa: 0.68, accuracy: 72.57%, recall: 76.09%. Correlation coefficient of wake: 0.91, N1: 0.65, N2: 0.86, N3: 0.73, REM: 0.85. |
| Gomes et al.48 | Pearson correlation coefficient (r) of AHI: 0.98, OAI: 0.87, CAI: 0.88, ODI: 1. AUC for altered OSA: 0.85, mild OSA: 0.70, moderate OSA: 0.73 and severe OSA: 0.93. |
AUC: areas under the curve; OSA: obstructive sleep apnea; AHI: apnea-hypopnea index; REM: rapid eye movement; CAI: central apnea index; OAI: obstructive apnea index; ODI: oxygen desaturation index.
This supervised system analyzes sleep stages, respiratory events, desaturations, limb movements, and awakenings, but cannot evaluate paroxysmal activity or bruxism. The steps of the analysis are: (1) artifact processing (minimization, identification, and channel selection), (2) feature extraction (slow wave, sleep spindles, k-complexes, delta, theta, alpha, slow and fast beta background activities, dominant alpha frequency, excitations, various types of artifacts, slow and rapid eye movements, blinks, and tonic and transient muscle activity), (3) AI classifier (bidirectional RNN with long- and short-term memory), and (4) rule-based subclassification of non-rapid eye movement sleep. Based on the probability of the RNN, the system uses a traffic light-style color code to indicate confidence in its score (green: high confidence, yellow: medium confidence, red: low confidence).
One of the limitations of automatic correction systems is the lack of validation in pediatric populations. In addition, there is a lack of pediatric datasets to train the AI model. This may limit the generalization of AI models in children49–50.
The following ML algorithms have been used in pediatric sleep apnea: CNN, SVM, RF, transformer-based model LSTM, and sleep staging model with adequate levels of accuracy49–51. Moeller et al. found that the U-Sleep automatic sleep stage correction software achieved an overall accuracy of 83.9% in sleep stages and a kappa value of 0.77 comparable to that of the human experts52. In another study, a model was developed that achieved an overall accuracy of 84.1% (Cohen’s kappa κ = 0.78), comparable to the reliability between manual experts, with no differences between children with sleep-disordered breathing and control groups53.
At the pediatric level, the Somnolyzer 24 × 7 has recently been validated for the first time in a pediatric population. A prospective, observational, and single- center study was conducted on 75 children aged 3-15 years who underwent PSG due to suspected OSA. Each PSG was corrected manually by three experts and automatically by the Somnolyzer 24 × 7 system. There was a high level of agreement between the manual and automatic respiratory disturbance index (RDI) scores. The mean correlation (Pearson’s correlation coefficient) of the RDI scored by the three experts was 0.93 (95% confidence interval [CI]: 0.92-0.95), similar to the correlation between the manual and automatic scores (0.92, 95% CI: 0.90-0.94). The correlation between the different manual scores and between the manual and automatic scores remained consistent across the different sleep stages (N1: 0.93 vs. 0.90; N2: 0.76 vs. 0.73; N3: 0.72 vs. 0.76; rapid eye movement [REM]: 0.86 vs. 0.82)54.
In conclusion, AI is part of the present and future of sleep medicine. The use of ML and neural networks may enable the development of new diagnostic methods, perform cluster analyses, and automate the correction of polysomnographic studies. In the future, deep learning models (large language models) may be used in the selection of the population at risk of OSA.
Funding
No funding was received.
Conflicts of interest
The authors declare there are no conflicts of interest that are relevant to the publication of this paper.
Ethical considerations
Protection of humans and animals. The authors declare that no experiments involving humans or animals were conducted for this research.
Confidentiality, informed consent, and ethical approval. The study does not involve patient personal data nor requires ethical approval. The SAGER guidelines do not apply.
Declaration on the use of artificial intelligence. The authors declare that no generative artificial intelligence was used in the writing of this manuscript.
